Ruby on Rails load testing habits
Here are the techniques I've acquired over more than 10 years of regular load testing.

I started with load testing on the music platform Official.fm, where artists and labels used to share their new tracks.
When someone like Wiz Khalifa, with millions of fans, suddenly shares a link to your website, you’d better get ready.
It was in 2012, and the Rails application could handle up to 2,000 requests per second.
The company eventually ran out of money, but I regularly tested the load on other projects.

I’m limiting the scope of this article to load testing on servers and not on development machines. The context is a Ruby on Rails application, but the article is generic enough to interest developers using other languages and frameworks.
Why run a load test
When running a load test, I always have at least one of the following objectives:
- Collecting metrics to keep improving performance
- Knowing the maximum throughput of the application
- Ensuring all server capabilities are exploited
The principle of a load test is to artificially increase traffic to discover bottlenecks that don’t exist with an average volume. I’m thinking, in particular, of database writes, which can begin blocking if there are too many of them. By discovering these bottlenecks ahead, it gives more time to consider them.
Knowing the maximum load an application can handle is critical when it has trafic peaks. I am thinking about ecommerce during black friday or news sites during elections. The stress test helps to know how many times the usual traffic can be supported. You can then decide to increase this margin.
If the application can’t saturate the CPU, there’s a fundamental problem. It’s a shame because it makes adding more servers less efficient. Money is being wasted on hosting costs, and this should be a priority to address.
Prerequisites
I always run a load test from a machine not used by the application. The result can’t be relevant if the testing machine saturates itself.
I make sure this machine is physically close to the application servers. The aim is to test the application part, not the network. It should be in the same data center to limit network latency. If that’s impossible, I ensure it’s in the same city or region. But I avoid crossing an ocean!
The load test machine doesn’t need to be as powerful as the application servers. A fraction of their power is sufficient, but I still avoid taking the smallest VM available. I often reuse one or more machines that are not very busy and not linked to the application. Otherwise, I will rent some for a few hours. It’s not very expensive, and there’s not much to install, so it’s quick.
If the application is behind a load balancer, I check that there is no sticky session. Otherwise, the load balancer will transfer all requests to the same application server, making the test less relevant.
Remember to authorize the IPs of your test machines if you use a limiter such as Rack::Attack.
How to run a load test
The load test can be very simple, involving a single page, or more realistic, with a scenario that simulates human visitors linking several pages at a predefined rate.
Simple tests with ApachBench et Siege
I use the venerable ApacheBench and Siege. It’s not original, but I know they are available in most, if not all, Linux distributions.
sudo apt-get install ab siege
Then, load testing a single page is extremely easy. It requires a number of requests, a concurrency and an URL:
$ ab -n 10000 -c 100 https://application.example/stress/test
[...]
Concurrency Level:      100
Time taken for tests:   15.372 seconds
Complete requests:      10000
Failed requests:        0
Total transferred:      570400000 bytes
HTML transferred:       560100000 bytes
Requests per second:    650.55 [#/sec] (mean)
Time per request:       153.717 [ms] (mean)
Time per request:       1.537 [ms] (mean, across all concurrent requests)
Transfer rate:          36237.53 [Kbytes/sec] received

Connection Times (ms)
              min  mean[+/-sd] median   max
Connect:        2   16  24.6      6     148
Processing:    16  136  29.7    141     339
Waiting:       15  133  28.7    138     319
Total:         60  153  21.8    153     346

Percentage of the requests served within a certain time (ms)
  50%    153
  66%    161
  75%    166
  80%    169
  90%    179
  95%    189
  98%    199
  99%    208
 100%    346 (longest request)
ApacheBench continuously sends 100 parallel requests up to a total of 10,000.
It displays many results, but there are only 2 that I always check.
I ensure Failed requests are equal to zero.
Then I look at the Requests per seconds.
I use that number to compare if an optimisation brought an improvement.
I switch to Siege when I need to test a bunch of URLs that can be listed in a file. The following command fetches all URLs from urls.txt for 1 minute at a concurrency of 100:
$ siege -t 1 -c 100 -f urls.txt

{ "transactions":                4981,
  "availability":              100.00,
  "elapsed_time":               59.38,
  "data_transferred":           93.21,
  "response_time":               1.18,
  "transaction_rate":           83.88,
  "throughput":                  1.57,
  "concurrency":                98.87,
  "successful_transactions":     4981,
  "failed_transactions":            0,
  "longest_transaction":         1.57,
  "shortest_transaction":        0.25
}
The 2 most important results are availability and transaction_rate.
Availability must be 100%, otherwise some requests failed.
The transaction rate is the number of requests per second.
Scenario tests
For specific scenarios, however, my choice is more surprising. I prefer to write a Ruby script with Typhoeus, which makes it very easy to send requests in parallel. That way, I’m entirely free to run any scenario.
My initial requirement was to send requests with unique parameters. To the best of my knowledge, no tool could do this.
So, 12 years ago, I developed a small utility class around Typhoeus to simplify script writing. I created a gem of it, which I unfortunately neither maintained nor documented. I’ve just resurrected it, and I’m happy to present to you web_tsunami.

With this gem, writing scenario is simple and limitless.
class SearchTsunami < WebTsunami::Scenario
  def run
    get("http://site.example") do
      # Block is executed once the response has been received
      sleep(5) # Simulate the time required for a human to visit the next page
      get("http://site.example/search?query=stress+test") do |response|
        # Do whatever you need with the response object or ignore it
        sleep(10)
        get("http://site.example/search?query=stress+test&page=#{rand(100)}") do
          sleep(5)
          get("http://site.example/stress/test")
        end
      end
    end
  end
end

# Simulates 100 concurrent visitors every second for 10 minutes
# It's a total of 60K unique visitors for an average of 23'220 rpm.
SearchTsunami.start(concurrency: 100, duration: 60 * 10)
This scenario simulates a visitor who consults the root page, launches a search after 5 seconds, clicks on a random page number after 10 seconds, and finally finds what he is looking for. Every second, 100 scenarios are started in a process. These are repeated for 10 minutes. That’s a total of 60K unique visitors in 10 minutes. That’s tiny compared to Shopify’s 1 million RPS, but it’s more than enough for most applications.
That was a trivial scenario. I let you go to the README if you want to see a more advanced one.
With these different tools, it’s possible to test a single page very simply or to write a much more advanced scenario. The next step is to interpret the test results.
Measure
Most load testing tools display the number of requests per second, the average, the median, and sometimes the distribution. This is basic information.
However, launching the load from several machines requires a tool to aggregate the results. It would help if you had an Application Performance Monitoring (APM) tool.
Moreover, the data is more precise since APM indicates bottlenecks in the code. You’re in luck; there are several good ones out there, and you’re currently on the website of one of them ;-)
First I check that the volume of traffic is consistent with what was sent by the test. Then, I review whether the response time (average and 95th percentile) has deteriorated compared with the usual traffic. Then, I dig deeper into the data to find the bottleneck.
The data are more representative when the test has run for several minutes. It is particularly true if the aim is to compare with another period or a previous test.
In addition to analyzing the application level, I also look at server measurements (CPU, load average, and memory). It gives an idea of the remaining margin compared to maximum traffic.
Stress test
The stress test aims to determine the maximum traffic the application can handle for a given scenario. It consists of running a load test and progressively increasing the volume until the limit is reached.
I usually run these tests directly in production to make them realistic. If this is impossible, ensure the environment is a faithful copy of production. Otherwise, the result will be of little interest.
Calculate concurrent requests
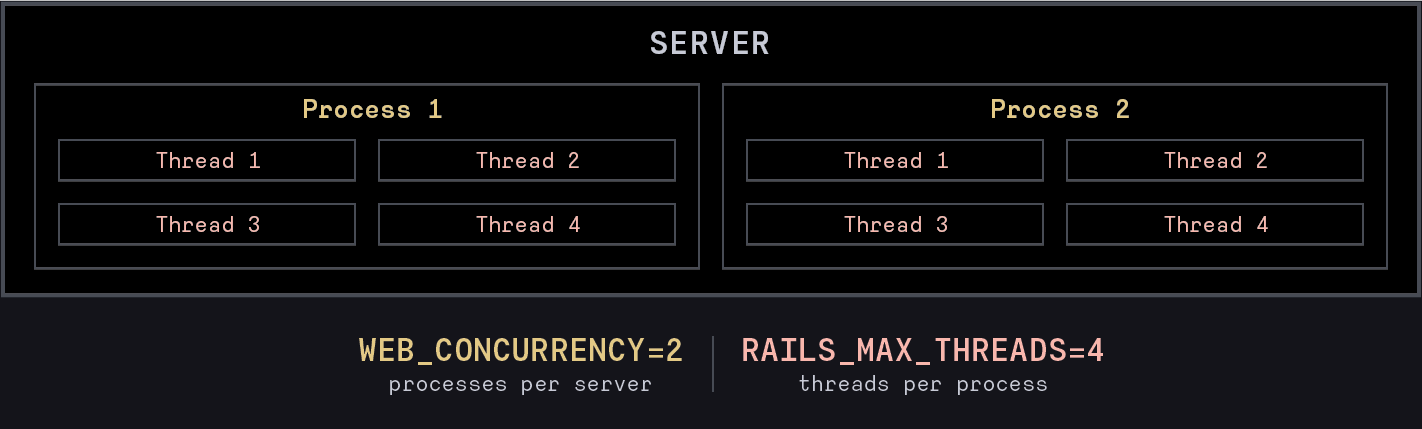
To get an idea, calculate all available Rails threads using the formula total_threads = servers * $WEB_CONCURRENCY * $RAILS_MAX_THREADS.
It works if all web servers are identical.
If your are not using Puma, replace WEB_CONCURRENCY by Rails processes and RAILS_MAX_THREADS by threads per process.
Don’t forget to take natural traffic into account and reduce the number of concurrent requests accordingly.
To calculate current concurrent requests, I use this formula natural_concurrency = throughput * avg_response_time.
So the number of requests to be sent to reach the limit should be around this value artifical_concurrency = total_threads - natural_concurrency.
This may vary if the page under test is slower or faster than the global average response time.
This value is the theoretical limit. In practice, however, it can be exceeded, as most servers queue requests when all threads are busy. This queue may have a limit, and this is when HTTP 503 errors occur.
This value should not be taken as an exact science. It gives an idea of the order of magnitude of the stress test intensity. It is even preferable to start lower and then gradually increase to avoid 503 errors.
Increase the load
The key is to keep an eye on server metrics and response times during the stress test. So you need to be careful and increase the load gradually.
I like the top command because it is available on any Unix machine. Moreover, it’s live information so that you can react quickly. The first few lines indicate the load average, CPU, and memory usage.
root@server:~$ top
top - 09:06:27 up 549 days,  2:41,  1 user,  load average: 1.20, 1.26, 1.35
Tasks: 232 total,   2 running, 230 sleeping,   0 stopped,   0 zombie
%Cpu(s): 10.9 us,  0.0 sy,  0.0 ni, 87.0 id,  0.0 wa,  0.0 hi,  2.1 si,  0.0 st
MiB Mem :  15904.6 total,    650.3 free,   2711.3 used,  12542.9 buff/cache
MiB Swap:   5120.0 total,   5066.2 free,     53.8 used.  12852.2 avail Mem
Here, the CPU user is 10.9%, and the load average is 1.2. Under Linux, the load average indicates the average number of processes running and waiting for CPU or IO. The load average is divided by the number of CPUs to convert it into a percentage. Note that it can exceed the number of CPUs, and therefore 100%.
For Linux only, the nproc command lets you determine the number of CPUs. Curious users can open the /proc/cpuinfo file.
root@server:~$ nproc
12
So when the load average has exceeded the number of CPUs, logically, the server has more work than it can handle. It means all CPUs are either busy or waiting for an IO. Ensure the app is still responding not too slowly and maybe decrease the test intensity.
However, maintaining a steady intensity could be a good idea to let the APM collect data. It provides representative data for identifying bottlenecks. I study them mainly a posteriori to better understand what needs to be improved.
Saturate the CPU
During stress testing, it’s essential to ensure that the application can saturate the CPU. It means it’s using all its power.
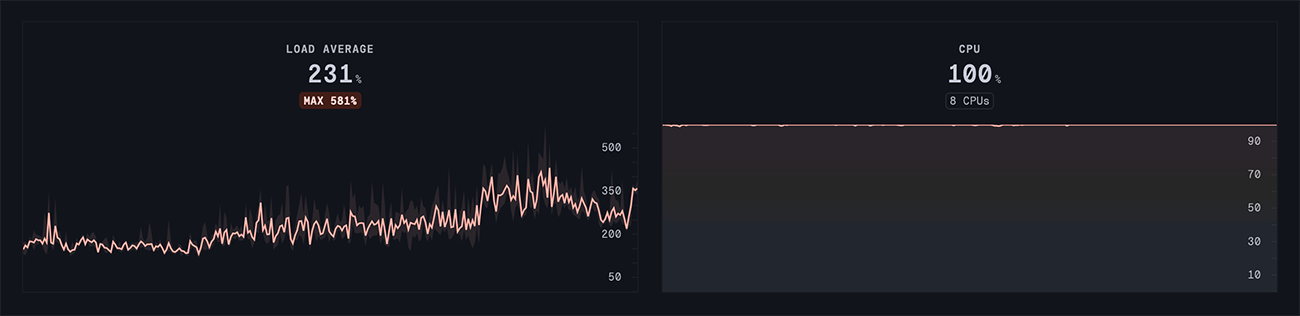
The perfect result would be a load average of 100% and a CPU at 100%. But this is impossible, as there are always inputs and outputs in a web application. So, the load average will always be higher than the CPU utilization because of IO expectations. I’ll take two opposite examples.
If the load average is 150% and the CPU is only 50%, an adjustment must be made. It means that processes are waiting for IOs, such as SQL queries. Increasing the number of threads is possible, if it does not worsen the blocking IO. But the best thing is obviously to optimize it. Unfortunately, adding more servers won’t necessarily increase the application’s capacity, for example, if the database is saturated.
If the average is 150% and the CPU is 99%, the server is being used to the maximum. You need to either add more servers or optimize the code to handle more requests.
Finally, if the load average cannot exceed 100%, there may not be enough instances of the application.
You must increase the number of processes and threads with the WEB_CONCURRENCY and RAILS_MAX_THREADS environment variables.
If the server is dedicated to the application, $WEB_CONCURRENCY ≥ nproc is required.
Before increasing these values, checking that the database can accept at least one connection per thread is essential.
Conclusion
It doesn’t matter which tool sends the requests. Running a load test is the easy part before optimizing. Above all, you need an APM to interpret the measurements and point out bottlenecks correctly. Finally, the most complicated part, which has not been covered, is optimization.
I’ve shared with you my habits and experience in running load tests. I’m not claiming this is the best way, but it has worked for me. I’m delighted if you’ve discovered some of the tricks. I’ll be even happier to learn yours.

